Posts

Showing posts with the label Imaging

Tips for removing markers of vertebral bodies in SECTRA IDS7

Image
Sometimes it happens that you get the last vertebral body number placement wrong or you do not double click with correct speed. Tips: You can remove the last marked vertebral body using BACKSPACE key on your keyboard. This way you do not have to start over. But the numbers have to be still active showing white square. See example of this T4 that can be removed by using BACKSPACE.

Clinical MRI Textbook

Image
Excellent link to great initiative by Val M. Runge, MD publishing free online Clinical MRI Textbook . Thank you for this valuable resource. Also thanks for the link to Sumer's Radiology Site .

CSF Leakage Spine - MRI Protocol

Image
I have already mentioned  CSF Leakage - Intracranial Hypotension and  Intracranial Hypotension before. Here I would like to present a simple and effective MRI protocol to show the CSF leakage. The clue is to use heavy T2 weighted sequence with thin slice, good resolution and what is most important - fat saturation. We want to get rid of epidural fat. Note on the images above the epidural CSF dorsally to dural sack that extends from cervical to low thoracic level. Sagittal projections show extend of the leakage, while tranversal images show more detail anatomy. This investigation was performed on Siemens Trio Tim 3T machine with the same sequence in two projections: - sag: t2_spc_sag_p3_iso_384_myelo Nex 2 Slice 0.8 mm TR: 1500 TE: 224 Flip angle: 110 - tra: t2_spc_tra_p2_iso_320_myelo Nex 2 Slice 1 mm TR: 1500 TE: 224 Flip angle: 110 For the location of the tranversal sections it is wise to ask your technicians to request radiologist supervision...

MCA Territory

Image
Unenhanced CT showing tissue loss after Middle Cerebral Artery MCA infarct involving whole territory of MCA. Note sparring of occipital lobe as well as medial temporal lobe - that belong to Posterior Cerebral Artery PCA territory. Also note medial parts of the frontal lobe that belong to Anterior Cerebral Artery ACA. Above unenhanced CT from the investigation three months prior at acute stage of infarct showing " Dense Vessel Sign " indicating occlusion of the main M1 segment of the MCA on the left side. CT Perfusion study at the time of acute infarct showing: increased Mean Transit Time MTT, decreased Blood Volume BV and decreased Blood Flow BF. Especially the decreased BF - represented by dark blue in the last image indicates infarct that can not be saved. Remember: " Blue is Bad " in CT Perfusion.

Gadolinium Guidelines

Image
T1 with iv Gadolinium and T2 showing non-enhancing, pathology verified Astrocytoma grade 2 in the medial parts of the left temporal lobe. Note distortion of the brain architecture. However subject of this post concerns Gadolinium Guidelines in attention to Nephrogenic Systemic Fibrosis. Here is the summary: Gadolinium Guidelines - eGFR 60 or greater - OK - eGFR 30-59 - weight-based dose of GBCA (0.2 mL/kg) can be administered with maximal dose of 20 mL allowed within 24 hours - eGFR less than 30 - GBCA cannot be administered except in cases of medical necessity; informed consent required; nephrology consultation required; hemodialysis should be considered According to: Yingbing Wang - Incidence of Nephrogenic Systemic Fibrosis after Adoption of Restrictive Gadolinium-based Contrast Agent Guidelines

MRI - Metal Screening

Image
Before every MRI we screen our patients for possible metal foreign bodies. Those can be implanted due to prior medical procedures as well as accidental. One of the specific inquiry concerns possible metal foreign bodies in the orbit. Sometimes patients work with metal and indicate possibility of being exposed to small projectile metal particles. In such case we check prior CT examinations for possible metal foreign bodies. Note above case of a small piece of metal located medially and superiorly in the left orbit. Here metal seems not to be attached to the globe. However due to risk of metal motion in strong magnetic field of the MRI scanner in a case like this we ask for ophthalmologist consultation. One should review scanogram as well as thin slices of the CT - considering size of foreign body and slice thickness. In case we do not have prior CT we order x-ray of the orbits.

CT Radiation Dose Report

Image
This is a standard radiation dose report generated by GE LightSpeed 64-slice CT scanner. This is a report of the CT Angiography including native CT Brain scan followed by CT Angiography of the Head and Neck. Values presented in this report are: CTDI - CT Dose Index and DLP - Dose Length Product. Some physics: The CTDI represents the radiation dose of a single CT slice and is determined using acrylic phantoms. The weighted CTDI (CTDIw) reflects the weighted sum of two thirds peripheral dose and one third central dose in a 100-mm range in acrylic phantoms. The volume CTDI (CTDIvol), defined as CTDIw divided by the beam pitch factor, is the most commonly cited index for modern MDCT equipment. The dose length product (DLP) is the CTDIvol multiplied by the scan length (slice thickness × number of slices) in centimeters. DLP is independent of what is being scanned. So it is the same for a little child as for a large adult. It is possible, but difficult, to estimate the effective dose equiv...

Intracranial Hemorrhage on MRI

Image
Case of a 2 days old neonate with bilateral subdural hematomas, mainly infratentorial. Note high signal on the coronal T1, low on GRE, high signal with level on T2 and same level on T1 sequences. Signal characteristics represent early subacute hematomas with methemoglobin still in the red blood cells. I would like to use this case as a reminder of signal changes of intracranial hematomas on MRI. The table above shows how we stage (name) hematomas according to time. Important observation is that the very early (hyperacute) hematomas contain Oxyhemoglobin and are difficult to see (isodense to brain) on T1 sequences. Same with Deoxyhemoglobin. Then after about 3 days we start to see high signal of Methemoglobin on T1. That continues to be high on T1 even when Methemoglobin is released from the hemolyzed Red Blood Cells, but then we start to see it as high even on T2. Late remains of the hemorrhage on MR can be seen as a rim of Hemosiderin deposits - that is just black. Gradient E...

Abscess and Subdural Empyema

Image
Patient previously operated for bilateral Subdural Hematomas (SDH) presented in febrile state with seizures. CT revealed peripherally enhancing cavity with surrounding edema parieto-temporally. Also noted were hyperdense SDH frontally and parietally with suspected leptomeningeal enhancement (arrows). MRI confirmed CT findings showing enhancing, fluid filled cavity with surrounding edema and subdural fluid collections showing high signal on FLAIR (last image) and leptomeningeal enhancement (third image). Note mass effect on the coronal image. Diffusion Weighted Imaging presented restricted diffusion of the fluid in the cavity showing high signal on DWI sequence and low signal on ADC map. This type of diffusion restriction in the fluid cavity is very suggestive for abscess. More cranially has DWI shown also restricted diffusion in the subdural fluid collections that indicate empyemas. With note that hematoma can also show restricted diffusion, high signal on FLAIR and leptomeningeal e...

Contrast Perfusion MRI

Image
Above color maps are from MRI Dynamic Susceptibility Contrast Perfusion (DSCP) study of the patient with follow-up after resection and radiotherapy of the parieto-occipitally located Anaplastic Astrocytoma eight years ago. There is no recurrent tumor - only gliosis. Sometimes DSCP can help in characterization of the  enhancement pattern of rest or recurrent tumor to differentiate if from radiation necrosis. This case has no contrast enhancement. Reason for this blog post is to mention this interesting MRI technique that I hope to expand on in the future. What we see are the color maps representing: TTP (Time To Peak) - that shows the regional distribution of arrival time of the bolus in the tissue CBF (Cerebral Blood Flow) CBV (Cerebral Blood Volume) MTT (Mean Transit Time) Above are T2, FLAIR and contrast enhanced T1 sequences from the same region as presented on the Perfusion maps. Note gliosis, tissue atrophy and lack of enhancement. Images from 3 Tesla scanner.

Late Subacute Hemorrhage on DWI

Image
Axial susceptibility weighted image (SWI) shows hemorrhage in the right inferior frontal gyrus with hypointense rim consistent with hemosiderin and central hyperintensity due to extracellular methemoglobin. The high signal intensity is also seen on the coronal nonenhanced T1. Diffusion weighted image (DWI) shows high signal and low on the corresponding ADC map which is consistent with restricted diffusion due to extracellular methemoglobin. There is also focal hemosiderin deposit in the left parietal lobe - shown on SWI, as well as many other smaller hemosiderin foci (not shown). Patient is suspected for amyloid angiopathy or multiple cavernomas.

Media Infarct - CT Perfusion

Image
Noncontrast CT shows reduced differentiation between cortex and white matter as well as subtle hypodensity in the left parietal lobe. Finding of acute infarct in the posterior territory of the arteria cerebri media. Blood Flow CT Perfusion shows markedly reduced flow (blue). Blood Volume shows reduced blood volume (blue). Mean Transit Time shows increased transit time in the left parietal lobe (blue). Remember - in CT Perfusion: "Blue is Bad" . See also my notes about CT Perfusion . Interesting new article in Radiology: Certainty of Stroke Diagnosis: Incremental Benefit with CT Perfusion over Noncontrast CT and CT Angiography by Julia Hopyan

Diffusion Weighted Imaging - MRI

Image
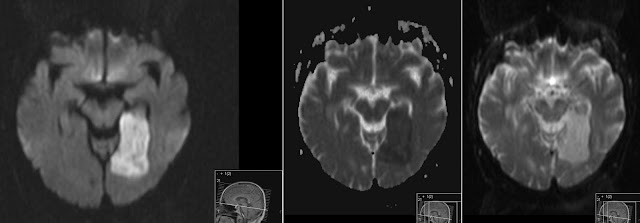
Diffusion Weighted Imaging (DWI) is a fast and very usefull MRI sequence that should be included in every brain scan. Quality is good on scanners with 1.5 T and more. PCA Infarct Above: subacute arteria cerebri posterior infarct in the left occipital lobe. Note restricted diffusion (high signal) on the isotropic DW image (the one with black CSF). Note black corresponding area on the ADC map (image with white CSF and "spots" around the brain). High signal on the last b0 image that is confirming T2 signal of the infarct. When you set the images in such order: DWI, ADC and T2 (b0) the configuration of signal: white - black - white indicates Restricted Diffusion. Small (lacunar) thalamus infarct Above: also infarct. This time a lacunar infarct in the left thalamus showing Restricted Diffusion on the DWI images. Glioblastoma Above: Glioblastoma tumor in the left temporal lobe showing rim enhancement on post contrast T1 and central necrosis. The necrotic...

Color art in CT Perfusion images of the brain.

Image
Here some nice colors of the CT Perfusion images of the brain. Showing: Mean Transit Time (MTT) - how fast the blood flows through the brain, Cerebral Blood Flow - how much blood flows in a specific period (ml of blood/100g tissue/min), and Cerebral Blood Volume - how much blood is in a volume of tissue. Excellent pdf article on CT Perfusion of the Brain from Martin Wiesmann is here:  CT Perfusion of the Brain - Martin Wiesmann