Chronic Subdural Hematoma: A Deeper Dive into MRI Sequences and Subdural Anatomy
Following our previous discussion on the clinical presentation of Chronic Subdural Hematoma (cSDH) and its appearance on CT, today we're going a step further. We'll utilize specific MRI sequences and CT correlation to gain a more detailed understanding of the signal characteristics of cSDH and, crucially, to properly visualize the anatomy of the subdural space, which is typically just a potential space but becomes strikingly apparent in this pathology.
All the images we'll examine today are from the same patient, providing a comprehensive, multi-modal overview of their diagnosis.
Expanding the Potential Space: The T1 Signal Characteristics
We begin our detailed look with an enlarged axial T1-weighted image. T1 sequences are excellent for anatomical detail and can sometimes help characterize fluid based on its protein content and hemorrhagic degradation products.

In this image, you can clearly see a fluid collection expanding along the cerebral convexity. The key takeaway here is the visualization of the subdural space. This space is normally "closed"—a potential space between the dura mater and the arachnoid membrane—and is not visible on routine imaging. However, in this patient with a cSDH, the space has pathological widened and is filled with hematoma, making its anatomical boundaries readily identifiable.
Regarding the signal of the hematoma fluid itself (indicated by the blue arrows): as you can observe, it is slightly hyperintense (gray) compared to the normal, dark signal of CSF. This subtly increased T1 signal indicates that the fluid is protein-rich and likely contains methemoglobin, a degradation product found in subacute to chronic hemorrhage.
Cortical Vein Shifts and Defining the Subdural Location: The T2 View
Next, we move to a single enlarged axial T2-weighted image, which provides excellent detail on the anatomical relationships.

T2-weighted images are particularly useful for visualizing fluid and vascular structures. Here, the cSDH fluid collection appears hyperintense (bright), similar to CSF but with subtle differences.
A critical anatomical finding is highlighted in this image (indicated by the larger blue arrows): the adjacent cortical veins, which lie within the subarachnoid space, are visibly shifted and displaced away from the inner margin of the hematoma collection. Crucially, these veins are not seen within the SDH collection itself.
Contrast this pathological finding with the expected normal situation: cortical veins freely crossing the CSF-filled subarachnoid space, which extends from the cortex to the inner table of the skull (tabula interna). The displacement of the cortical veins inward by the extra-axial fluid collection confirms that the hematoma is indeed located in the subduralspace (outside the arachnoid membrane), pushing the underlying subarachnoid space and its contents medially.
Hemosiderin and Multi-modal Correlation on SWI and CT
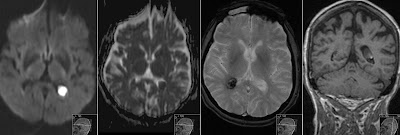
Now, let's examine the appearance of cSDH across different modalities and sequences, including the specialized Susceptibility Weighted Imaging (SWI). Next image provides a 4-up montage for this comparison.

Our primary focus is the top two images in the montage, which are SWI sequences. SWI is extremely sensitive to susceptibility effects from blood degradation products like hemosiderin and ferritin. In these images, the areas of hemosiderin deposition appear distinctly hypointense (black) and show "blooming" artifacts along the membranes and borders of the chronic subdural collection. This finding is characteristic of chronic hemorrhage, indicating the accumulation of iron-containing pigments from recurrent microbleeding within the hematoma membranes.
You can correlate this SWI finding with the corresponding images in the montage: the T1 axial (bottom left) reinforced the expanded space visualization and slightly increased signal discussed earlier, and the CT coronal slice (bottom right), which shows a typical hypodense/isodense chronic collection, helping to map the multiplanar anatomy.
High Signal on FLAIR: Confirming Protein-Rich Fluid
Finally, we look at the FLAIR (Fluid-Attenuated Inversion Recovery) sequence, shown on the right side of next image 4-up montage.

FLAIR sequences null the signal from normal CSF (making it dark), making them very effective for identifying pathology within CSF-containing spaces or fluid collections.
In the FLAIR images (right side), you can clearly observe the high signal (hyperintensity) of the protein-rich fluid filling the cSDH collection. While the normal CSF within the ventricles and sulci is dark, the subdural fluid collection is bright. This high signal is a reliable indicator of the elevated protein concentration and subacute/chronic hemorrhagic components within the cSDH, which resist FLAIR nulling.
Again, correlate these findings with the other images: the T2 axial (top left) reinforced the anatomical shift of the cortical veins (noted in image_15.png), and the coronal T1 (bottom left) confirms the anatomical extension of the collection in multiple planes and its T1 signal characteristics.
Summary of Imaging Findings in cSDH
In conclusion, understanding the appearance of Chronic Subdural Hematoma requires looking beyond simple density on CT. By examining specific MRI sequences like T1, T2, SWI, and FLAIR, along with CT correlation, we can:
Properly visualize the normally "closed" subdural space, which becomes expanded and visible.
Characterize the hematoma fluid as protein-rich and chronic (slightly hyperintense on T1, hyperintense on FLAIR, and displaying hemosiderin deposits on SWI).
Confirm the subdural location by observing the displacement of cortical veins within the underlying subarachnoid space.
Utilizing this multi-modal approach ensures a precise diagnosis and a deeper appreciation of the underlying pathology.

Watch my video on Radiant Pixels about Chronic Subdural Hematoma